


Search News
Global Industrial Intelligence Hub (GIIH)Industry Portal
Global Industrial Intelligence Hub (GIIH)Status
Standard Access
Upgrade to PremiumNewsSupply chain mapping is getting harder in multi-country sourcing
Time
Click Count
As multi-country sourcing expands, supply chain mapping is becoming more complex for buyers managing procurement, inventory control, and logistics management across diverse markets. From automotive components and industrial parts to EV battery, EV motor, and aftermarket demand, companies must trace suppliers, validate high-quality parts, and reduce risk. This article explores how better supply chain visibility supports smarter sourcing decisions, stronger compliance, and more resilient global operations.
Why supply chain mapping gets harder when sourcing spans multiple countries
Supply chain mapping used to focus on a short list of direct vendors. In multi-country sourcing, that approach is no longer enough. A buyer may contract with 3 to 5 tier-1 suppliers, but the actual risk often sits 2 or 3 tiers deeper, where sub-suppliers provide castings, electronics, chemicals, packaging, connectors, or critical minerals. Once procurement is spread across Southeast Asia, Eastern Europe, Latin America, and China at the same time, the number of operational touchpoints rises quickly.
For information researchers and business evaluators, the challenge is not only identifying who supplies what. It is also verifying where production takes place, which plant ships which batch, how inventory buffers are structured, and whether logistics routes create hidden exposure. A lead time that looks stable at 2 to 4 weeks on paper can turn into 6 to 10 weeks when customs reviews, feeder vessel delays, or component substitutions occur.
This is especially relevant in sectors linked to automotive parts, EV battery systems, EV motor assemblies, and industrial aftermarket supply. These categories often combine strict quality tolerances, regional compliance needs, and volatile demand cycles. A distributor or sourcing manager may face one set of standards in the destination market, another at the component origin, and a third from the end customer’s internal vendor approval process.
The result is a practical problem: more countries do not automatically mean more resilience. Without clear supply chain mapping, multi-country sourcing can simply create more blind spots. Companies gain optionality, but they also inherit fragmented data, uneven supplier transparency, and more decision points that can slow procurement or increase risk.
Where the complexity usually increases first
- Supplier identity becomes layered, with traders, contract manufacturers, and actual production sites appearing under different legal entities.
- Material traceability weakens when one finished part depends on 4 to 8 upstream inputs sourced from several countries.
- Logistics planning gets harder when sea, air, rail, and cross-border trucking must be combined across multiple handoff points.
- Compliance checking expands beyond one market and may include labeling, origin records, restricted substances, or sector-specific testing files.
What buyers, distributors, and evaluators need to map beyond the first supplier layer
A useful supply chain map should do more than list approved vendors. It should connect commercial, operational, and compliance data into a structure that procurement teams can actually use. In practice, this means tracing at least 4 core dimensions: supplier ownership, manufacturing location, component dependency, and transport path. If one of these is missing, the sourcing picture remains incomplete.
For procurement personnel, the first priority is identifying single points of failure. Two suppliers in different countries may appear diversified, yet both might depend on the same molding plant, battery material processor, or chip packaging facility. For distributors and agents, channel risk is also important. Parallel export, unauthorized substitution, or inconsistent after-sales support can damage pricing discipline and customer trust.
For business assessment teams, mapping should include commercial viability indicators. These may include production concentration, seasonal capacity pressure, payment term sensitivity, and alternate route availability. Even basic ranges are useful. For example, safety stock below 2 weeks, ocean transit above 30 days, or a customs dependency on a single port can signal elevated sourcing exposure.
At GIIH, this is where industrial intelligence creates value. Instead of treating fragmented trade information as isolated facts, structured mapping turns supplier records, logistics patterns, technology dependencies, and regional market signals into decision support. That approach is particularly useful when teams need to compare sourcing options across several markets without losing visibility into the deeper supplier network.
A practical supply chain mapping checklist
- Confirm legal entity, production site, and shipment origin separately rather than assuming they are the same.
- Identify 3 levels of supply where possible: finished goods supplier, critical component source, and key raw material origin.
- Record standard lead time, rush lead time, and typical order cycle such as monthly or quarterly replenishment.
- Check whether alternate ports, alternate plants, or backup tooling exist and how long activation would take.
- Verify compliance documents by market, especially if goods move between 2 or more customs jurisdictions before final delivery.
Core fields that make a map actionable
An actionable map usually needs 6 to 8 fields per supplier node: company name, site location, supplied part or process, monthly capacity range, lead-time range, transport mode, compliance documents, and substitute source status. This is basic enough to maintain but detailed enough to support sourcing decisions. When teams skip these fields, mapping becomes a visual exercise rather than a procurement tool.
How to compare sourcing models before supply chain visibility breaks down
Not all multi-country sourcing models carry the same mapping burden. Some companies split orders by region, some dual-source the same part, and some build a hub-and-spoke model around one major supplier network. The right model depends on demand volatility, product complexity, compliance burden, and the cost of a stockout. Comparing models early can prevent later confusion in supplier governance and inventory planning.
The table below helps buyers and evaluators compare common sourcing structures used in industrial components, automotive parts, and aftermarket programs. It focuses on practical trade-offs rather than theory, so teams can match supply chain mapping effort to actual operational need.
The comparison shows a common pattern: resilience increases only when mapping quality also improves. A dual-country or regionalized model can reduce dependency, but it also raises the need for data discipline. In many sourcing programs, the failure does not come from adding countries; it comes from adding countries without a clear method for supplier comparison, sub-tier validation, and route monitoring.
For EV battery and EV motor supply chains, this issue becomes sharper because material origin, process capability, and transport conditions can influence qualification. For industrial spare parts, the risk may center more on drawing consistency, aftermarket interchangeability, and batch-level documentation. The mapping method should therefore match the category, not just the geography.
A simple decision rule for procurement teams
If a part is high value, technically sensitive, or tied to customer warranty exposure, map at least 3 tiers and review monthly. If it is low complexity but operationally important, a 2-tier map reviewed every quarter may be sufficient. This distinction helps control workload while keeping critical supply chain visibility where it matters most.
Which procurement indicators matter most for supply chain visibility and compliance
When teams evaluate suppliers across several countries, they often collect too many documents and too little decision-ready information. The better approach is to focus on a smaller group of indicators that directly affect risk, continuity, and customer delivery. For most B2B sourcing programs, 5 categories are especially useful: identity, capacity, lead time, compliance, and recovery options.
The next table organizes these indicators into a practical screening tool. It is relevant for procurement staff, market researchers, and channel partners that need to compare suppliers or production sites quickly without losing operational detail.
These indicators are useful because they connect supply chain mapping to procurement decisions. A map is only valuable if it helps answer real questions: Can this supplier deliver in the required window? Is there a hidden sub-tier dependency? Will compliance documents remain valid for the destination market? Can the business switch sources within a workable timeframe if demand spikes or a disruption occurs?
This is also where a specialized industrial intelligence platform such as GIIH adds practical support. By combining sector depth in logistics, automotive parts, mobility supply chains, and cross-border trade analysis, GIIH helps turn scattered supplier and market signals into comparable procurement intelligence. That matters when a sourcing team must move from data collection to a defendable sourcing recommendation.
Common compliance issues that disrupt otherwise qualified supply chains
- Mismatch between declared origin and actual manufacturing location after subcontracting changes.
- Outdated material or component declarations after design revisions or alternate sourcing.
- Incomplete batch traceability for aftermarket and warranty-sensitive products.
- Lack of synchronized document updates across supplier, freight, and importer records.
How to implement a stronger mapping process without slowing procurement
Many teams worry that better supply chain mapping will add bureaucracy. In reality, the goal is the opposite. A structured process should reduce repeated verification, shorten escalation time, and make sourcing decisions more consistent. The most effective programs usually operate in 4 stages: baseline mapping, risk scoring, validation, and review. This can often be launched first on the top 20% of SKUs that drive the highest business exposure.
Baseline mapping starts with direct suppliers and critical components. Risk scoring then ranks each node using factors such as sole-source dependency, lead-time volatility, customs complexity, and compliance sensitivity. Validation checks whether the map reflects actual production and shipping practice. Review creates a cadence, such as monthly for high-risk categories and quarterly for stable categories.
For distributors and agents, the same method can be adapted to channel management. Map not only the manufacturing source, but also who holds stock, who controls regional warranty response, and which entity supports replacement parts. In many aftermarket environments, channel inconsistency causes more disruption than factory output itself. A supply chain map should therefore follow the commercial path as well as the physical product path.
The implementation process works best when supported by category-specific intelligence. Automotive components, electronics, industrial consumables, and EV-related assemblies do not carry the same risks. GIIH’s cross-sector intelligence framework is useful here because it connects logistics signals, manufacturing standards, regional market shifts, and supply chain bottleneck analysis into one decision view rather than separate reports.
A 4-step operating model for procurement teams
- Map the supplier network by product family and identify critical nodes that affect delivery, warranty, or compliance.
- Score each node using 5 criteria: concentration risk, lead time, documentation quality, route dependence, and recovery option.
- Validate the highest-risk nodes through document checks, shipment reviews, and direct confirmation of production arrangements.
- Review on a fixed cycle, often every month for volatile categories and every quarter for stable lines.
What not to do
Do not assume dual sourcing is automatically diversified. Do not rely only on commercial invoices to prove origin or production depth. Do not treat emergency buys as outside the mapping program. And do not let supplier onboarding happen without route and compliance visibility. These are common reasons why multi-country sourcing becomes harder than expected, even for experienced teams.
FAQ: practical questions about supply chain mapping in multi-country sourcing
How deep should supply chain mapping go for industrial and automotive parts?
For routine, low-risk items, mapping to tier 2 may be enough. For components tied to safety, warranty, regulatory exposure, or long replenishment cycles, mapping to tier 3 is often more useful. If a part has a lead time above 4 weeks or depends on a specialized process, deeper visibility becomes more valuable because switching sources later may be costly or slow.
What is the biggest mistake buyers make in multi-country sourcing?
A common mistake is thinking supplier count equals resilience. If 2 suppliers depend on the same sub-tier source, port, or raw material processor, the exposure remains concentrated. Another mistake is separating procurement data from logistics data. A source may look competitive on unit price while carrying hidden transit variability or customs risk that weakens total supply reliability.
How often should a supply chain map be updated?
There is no universal schedule, but category-based review works well. High-risk or fast-changing categories may need monthly review. More stable products can often be reviewed every quarter. Updates should also be triggered by supplier relocation, tooling transfer, major engineering change, route disruption, or any compliance document revision affecting shipment eligibility.
Does better mapping always increase sourcing cost?
Not necessarily. It may add upfront effort, but it often reduces hidden cost later by preventing stockouts, premium freight, duplicate qualification work, or shipment delays. In many B2B settings, the real savings come from better prioritization. Teams can focus deeper checks on the 10% to 20% of suppliers or SKUs that create the largest operational or compliance exposure.
Why work with GIIH when supply chain mapping becomes a strategic sourcing issue
When procurement stretches across several countries, the problem is rarely a lack of information. The problem is fragmentation. Teams have supplier files, shipment records, market notes, compliance requests, and pricing updates, yet still struggle to form a clear sourcing picture. GIIH is built to close that gap by turning dispersed industrial signals into structured intelligence for global decision-making.
Our strength lies in connecting market research, trade insight, logistics monitoring, and sector-specific analysis across supply chain-intensive industries. For buyers, business evaluators, distributors, and sourcing teams, this means more than trend commentary. It means support in understanding where supplier risk sits, which sourcing options are realistic, and how regional shifts may affect continuity, cost, and channel performance over the next 3 to 12 months.
If your team is reviewing multi-country sourcing for industrial parts, automotive components, EV battery inputs, EV motor supply, or aftermarket programs, you can consult GIIH on specific decision points. These include supplier landscape screening, sourcing model comparison, lead-time and route analysis, compliance checkpoint planning, and region-by-region risk interpretation for procurement and commercial planning.
You can also reach out when you need practical support around parameter confirmation, supplier selection logic, expected delivery windows, alternate source assessment, certification-related document planning, sample support coordination, or quotation discussion priorities. That makes the conversation useful from the start, especially when decisions must balance speed, compliance, and long-term supply chain visibility.
What you can discuss with us
- How to build a supply chain mapping framework for 2 to 5 sourcing countries without overloading the procurement team.
- How to compare supplier networks for industrial parts, mobility components, or aftermarket distribution programs.
- How to review lead times, logistics paths, and fallback options before committing annual or quarterly sourcing plans.
- How to prepare for documentation, origin, and compliance checks when serving multiple destination markets.
For organizations navigating more complex global sourcing decisions, a clearer map leads to better procurement judgment. GIIH helps transform that map from a static supplier list into a decision tool that supports resilience, compliance, and smarter industrial growth.
Recommended News
 Sep 24, 2026When does supply chain management software pay for itself?Supply chain management software pays for itself by reducing avoidable inventory, freight, stockout, and planning costs. Learn how to build a credible ROI case.
 Sep 20, 2026How supplier compliance monitoring reduces disruption riskSupplier compliance monitoring helps teams spot risks early, prevent costly disruptions, strengthen supplier resilience, and protect operational continuity.
 Sep 16, 2026What makes a procurement research platform reliable for supplier sourcing?A procurement research platform for sourcing helps teams identify credible suppliers, assess risk, verify evidence, and build defensible shortlists for smarter decisions.
 Sep 07, 2026How to compare cross border logistics services for reliable deliveryCompare cross border logistics services with confidence. Learn how to assess customs, tracking, costs, final-mile coverage, and exception handling for reliable delivery.
 Sep 05, 2026How to Compare an Order Fulfillment Pricing Model by Total CostOrder fulfillment pricing model guide: compare total costs across storage, shipping, returns, fees, and service levels to select the right fulfillment partner.
 Sep 07, 2026Sourcing Semi-Trailer Spare Parts Without Compromising Brake Drum QualitySemi trailer spare parts sourcing guide: choose reliable brake drums with verified fitment, traceability, and quality control to protect safety, uptime, and costs.
 Aug 28, 2026France Lowers Foreign Investment Review Threshold to 10% for Non-EU BuyersFrance lowers its foreign investment review threshold to 10% for non-EU buyers, reshaping strategic deals, compliance planning, and cross-border investment.
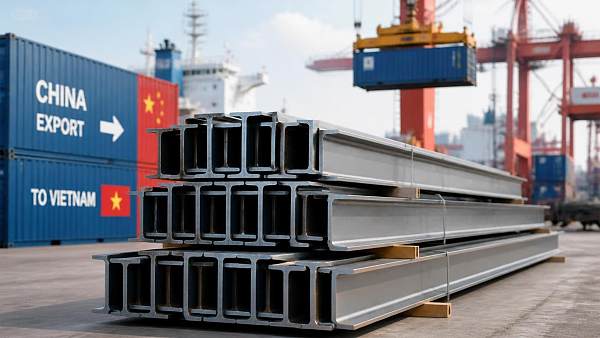
 Aug 25, 2026Vietnam Cuts Anti-Dumping Duty on Chinese H-Beam Steel to 6.78%Vietnam cuts anti-dumping duty on Chinese H-beam steel to 6.78%, reshaping import costs and sourcing decisions in Southeast Asia. See what buyers and traders should do next.
 Aug 21, 2026France Lowers Foreign Investment Review Threshold to 10% for Non-EU BuyersFrance lowers its foreign investment review threshold to 10% for non-EU buyers, reshaping deals in strategic sectors. See what this means for investors, timelines, and cross-border transaction risk.
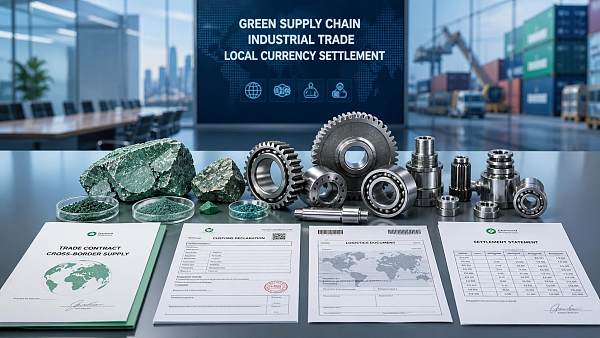
 Aug 20, 2026BRICS Reaches Consensus on Green Minerals Supply Chains and Wider Local-Currency TradeBRICS green minerals supply chains and wider local-currency trade could reshape industrial exports, settlement, and compliance. See what Chinese exporters should watch next.
 Aug 19, 2026RCEP Steel Conference in Nanning Highlights Green Low-Carbon Technology CooperationRCEP Steel Conference in Nanning highlights green low-carbon technology cooperation, tariff rules, and compliance trends shaping steel exports, supply chains, and new regional business opportunities.
 Aug 18, 2026Second Strait of Hormuz Closure Raises Supply Chain Risks as Oil and Freight Costs ClimbSecond Strait of Hormuz closure raises supply chain risks as oil and freight costs climb. Explore impacts on shipping, pricing, and key export sectors now.
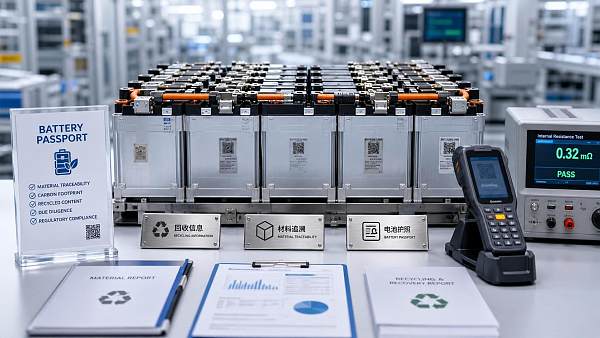
 Aug 16, 2026EU Battery Passport Becomes Mandatory for Exported Storage Products on August 18EU Battery Passport becomes mandatory on August 18, 2026 for exported storage products above 2kWh. Learn what Chinese exporters, integrators, and OEMs must do to stay compliant.
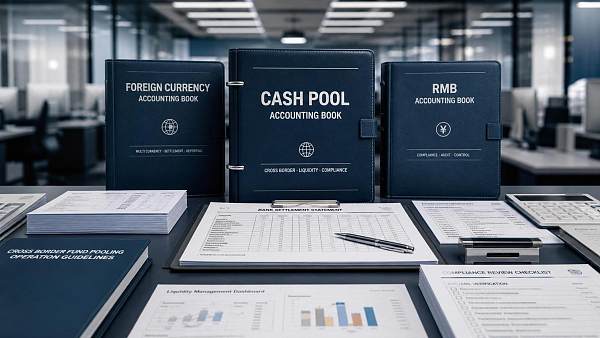
 Aug 15, 2026China Widens Cross-Border Cash Pool Access for Multinationals on Sept. 14China widens cross-border cash pooling for multinationals on Sept. 14, boosting treasury efficiency, liquidity, and payment coordination for China-linked businesses.
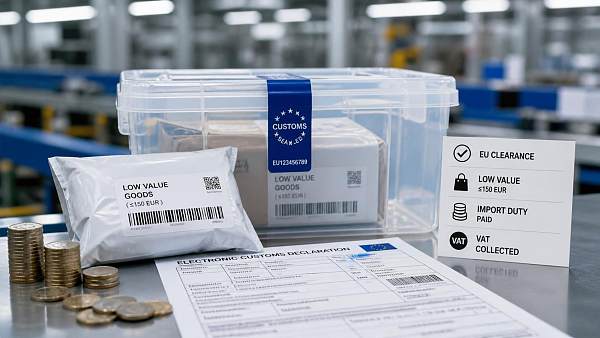
 Aug 13, 2026EU Ends Low-Value Parcel Duty ExemptionEU ends the low-value parcel duty exemption, reshaping China-to-EU e-commerce costs, customs compliance, and delivery models for exporters and logistics teams.
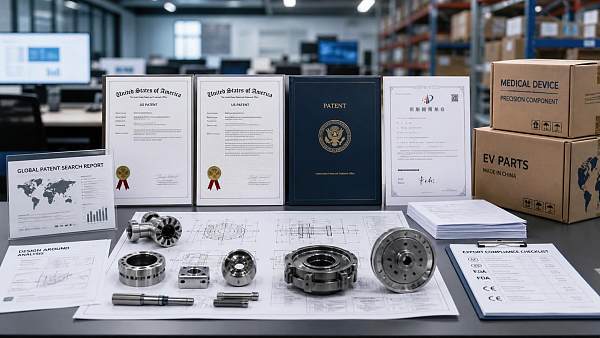
 Aug 12, 2026Jiangsu Tightens Overseas Patent Rules for ExportersJiangsu Tightens Overseas Patent Rules for Exporters: learn how new patent search, design-around, and local filing demands may reshape market access in the US, Europe, and Southeast Asia.
 Aug 11, 2026EU CBAM Expansion Adds Hydrogen Products, Pre-Filing Starts Oct 2026EU CBAM expansion adds hydrogen products and starts pre-filing in Oct 2026. Learn how Chinese exporters can prepare carbon data, electricity records, and compliance workflows now.
 Jul 15, 2026Global Shipping Logistics Customs Clearance: Common Delays and How to Prevent ThemGlobal shipping logistics customs clearance made simple: learn the most common delay triggers, reduce document and HS code errors, and keep cross-border shipments moving faster.
 Jul 13, 2026Cloud Project Specification Planning: How to Prevent Scope Gaps Before Procurement StartsCloud project specification planning helps teams define scope, compliance, integrations, and cost drivers before procurement begins—reducing risk, avoiding change requests, and improving vendor fit.
 Jul 12, 2026Logistics Management Analytics: Which KPIs Improve Delivery and Inventory Control?Logistics management analytics helps identify the KPIs that truly improve delivery speed, inventory accuracy, and service reliability across complex supply chains.
 Jul 11, 2026Ecommerce Logistics Sourcing Guide: How to Compare Lead Time, MOQ, and Shipping CostsEcommerce logistics sourcing guide for buyers comparing lead time, MOQ, and shipping costs. Learn how to reduce landed cost risk, improve supplier selection, and make smarter sourcing decisions.
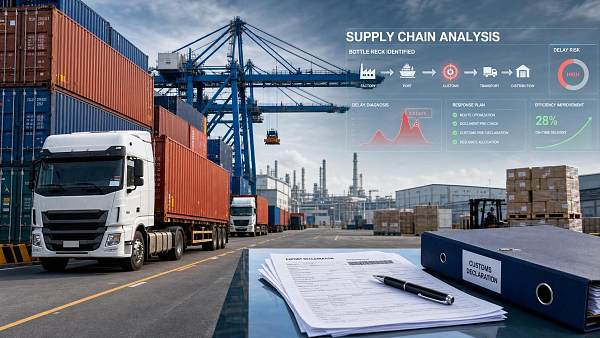
 Jul 10, 2026Supply Chain Bottleneck Analysis for Exporters: Where Delays Happen and How to RespondSupply chain bottleneck analysis for exporters reveals where delays start—from suppliers and documentation to ports and delivery—and shows practical ways to respond faster, cut risk, and protect margins.
 Jul 09, 2026Supply Chain Intelligence Europe: Which Data Signals Matter for Sourcing Decisions?Supply chain intelligence Europe: discover the key data signals shaping smarter sourcing decisions, from supplier risk and lead times to compliance, costs, and logistics performance.
![]() Jul 07, 2026Supply Chain Intelligence and ISO Standards: How to Align Data, Traceability, and ComplianceSupply chain intelligence ISO standards explained: learn how to align data, traceability, and compliance to reduce risk, speed audits, and build resilient operations.
Jul 07, 2026Supply Chain Intelligence and ISO Standards: How to Align Data, Traceability, and ComplianceSupply chain intelligence ISO standards explained: learn how to align data, traceability, and compliance to reduce risk, speed audits, and build resilient operations.