


Search News
Global Industrial Intelligence Hub (GIIH)Industry Portal
Global Industrial Intelligence Hub (GIIH)Status
Standard Access
Upgrade to PremiumNewsThe supply chain risk that standard dashboards ignore
Time
Click Count
Standard dashboards often track inventory control and logistics management but miss the hidden supply chain signals shaping procurement decisions. From aftermarket auto parts and precision engineering to EV battery, EV motor, and custom components, today’s global networks demand deeper visibility. This article explores how buyers, distributors, and analysts can detect overlooked risks across industrial parts, automotive components, and high-quality parts before disruption turns into lost revenue.
Why standard supply chain dashboards miss critical risk signals
Most dashboards are built to summarize what has already happened. They highlight stock levels, shipment milestones, purchase order status, and supplier delivery dates. These indicators matter, but they often sit too close to the transaction layer. For procurement teams and business evaluators, the bigger problem is that supply chain risk usually starts 2–8 weeks before a missed shipment appears on a dashboard.
In industrial procurement, especially across automotive components, EV battery modules, EV motor assemblies, and custom precision parts, risk rarely begins with a red warning icon. It begins with subtler changes: rising lead-time variability, repeated engineering revision requests, unusual minimum order quantity shifts, regional customs slowdowns, and inconsistent raw material substitution. Standard dashboards often ignore these weak signals because they are harder to structure.
This gap matters for information researchers, sourcing managers, distributors, and channel partners. A dashboard may show that a supplier shipped on time in the last 90 days, yet it may not reveal that the supplier’s second-tier machining partner is overloaded, that a key magnet material is becoming constrained, or that product documentation now requires 3 rounds of clarification instead of 1. These changes can alter total procurement risk well before inventory falls.
GIIH approaches this problem from an industrial intelligence perspective. Instead of reading supply chains only as logistics flows, it reads them as connected knowledge systems involving manufacturing capability, cross-border trade friction, compliance expectations, technical change, and downstream demand swings. That broader view helps decision-makers identify overlooked supply chain signals before disruption becomes a margin problem or a customer service failure.
The difference between visible metrics and hidden indicators
Visible metrics are easy to report: on-time delivery, inventory turnover, fill rate, transport cost per unit, and warehouse aging. Hidden indicators are less obvious but often more predictive. These include supplier response speed over 24–72 hours, engineering change frequency per quarter, documentation completeness at sampling stage, and the spread between quoted lead time and actual production slot availability.
- Transaction metrics tell you what is moving now.
- Capability signals tell you whether the supplier can continue performing in the next 30–120 days.
- Market signals tell you whether external pressure is building around material, regulation, or transport capacity.
When procurement teams rely only on transaction metrics, they may optimize for apparent stability while missing structural fragility. That is why a broader supply chain risk framework is essential for industrial sourcing and global trade planning.
Which overlooked signals matter most in automotive parts and industrial components?
Not every weak signal deserves the same weight. In aftermarket auto parts, precision automotive parts, and custom industrial components, the most useful signals are the ones that affect continuity, substitution difficulty, and field performance. A delayed carton is manageable. A delayed validated component with limited alternative tooling is not. Buyers need a practical framework for ranking what truly threatens supply continuity.
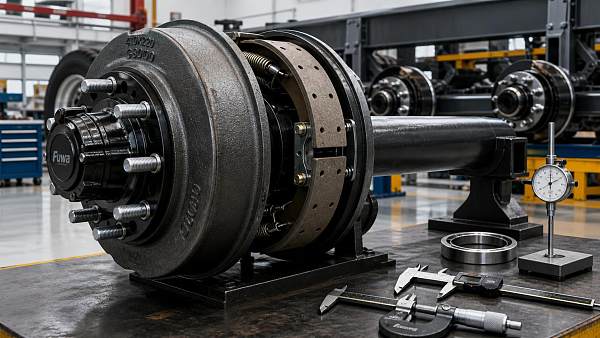
For example, an EV motor component may depend on specialized winding, magnet sourcing, and tight dimensional tolerances such as ±0.05 mm to ±0.2 mm, depending on design and application. In that context, supplier risk is not only about finished goods inventory. It is also about process stability, access to qualified sub-suppliers, inspection consistency, and the supplier’s ability to manage specification drift across batches.
In aftermarket channels, distribution risk looks different. Demand patterns can be uneven across regions, urgent orders may cluster into 7–15 day windows, and product interchangeability can be misunderstood. A dashboard that only tracks warehouse stock may miss whether labeling standards, fitment data quality, or packaging robustness are weakening channel performance. For distributors and agents, these details directly affect returns, warranty disputes, and customer trust.
The table below summarizes overlooked supply chain signals that deserve routine monitoring for industrial parts procurement, especially when buying across borders or evaluating new supplier programs.
These signals do not prove failure on their own, but together they form an early-warning pattern. For business assessment teams, combining 4–6 such indicators usually gives a more realistic picture than relying on a single on-time-delivery score.
Risk signals by sourcing context
For EV battery and EV motor procurement
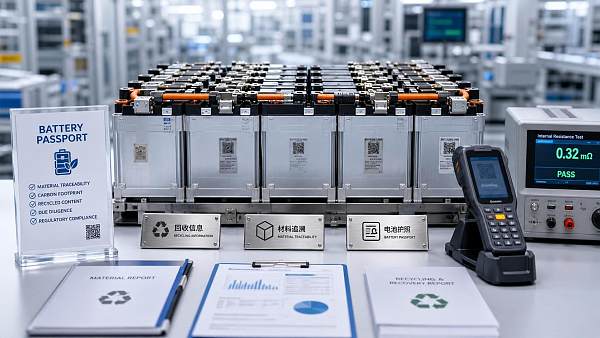
Pay closer attention to traceability depth, thermal or material handling requirements, process documentation discipline, and the availability of second-source options. These categories often have tighter validation expectations and longer substitution cycles, commonly 4–12 weeks or more depending on qualification requirements.
For aftermarket auto parts distribution
Focus on fitment data quality, packaging durability, return trends, and consistency between catalog claims and actual field use. In many aftermarket programs, margin erosion comes not from unit price alone but from claims, returns, and channel dissatisfaction over 1–2 selling seasons.
For custom industrial parts
Review process capability, tooling backup, raw material grade continuity, and inspection reporting. If a part has limited interchangeability and batch-sensitive performance, then hidden supply chain risk often sits inside process control rather than freight visibility.
How buyers and analysts can build a stronger procurement risk assessment
A stronger assessment model should move beyond “price, lead time, and stock.” In B2B sourcing, especially across industrial parts and cross-border trade, teams should score suppliers through at least 5 dimensions: supply continuity, technical clarity, compliance readiness, logistics resilience, and commercial responsiveness. This creates a more balanced view of operational risk and business fit.
The practical goal is not to eliminate uncertainty. It is to prevent surprises that damage revenue, customer fulfillment, and planning accuracy. For sourcing teams working under quarter-end pressure, a structured model also reduces internal debate. Instead of arguing from anecdotes, procurement, engineering, and commercial teams can evaluate suppliers using the same decision framework over 30-day, 60-day, and 90-day horizons.
GIIH supports this style of decision-making by integrating trade insight, manufacturing knowledge, logistics monitoring, and sector-specific interpretation. That matters when a buying decision spans more than one discipline. A part may be technically acceptable, yet commercially risky. Or logistics may appear stable, while compliance preparation is weak. Industrial intelligence helps connect those gaps before commitment.
The following comparison table can be used as a procurement screening tool when evaluating suppliers, distributors, or sourcing alternatives in automotive components and industrial supply chains.
The difference is simple: a basic dashboard describes current operations, while a stronger procurement view tests future resilience. That shift is especially useful for distributors, agents, and procurement managers handling mixed portfolios with both standard and custom parts.
A 4-step evaluation process before placing volume orders
- Validate technical clarity: confirm drawings, tolerances, material grades, interchangeability, and revision control before sample approval.
- Test supply continuity: ask about normal lead time, peak-season lead time, backup production arrangements, and upstream dependency concentration.
- Check logistics and compliance fit: review shipping windows, packaging method, labeling, customs document readiness, and regional market requirements.
- Model commercial exposure: compare landed cost, switching cost, safety stock requirement, and order flexibility across at least 2–3 supplier options.
This process helps avoid a common procurement mistake: selecting the lowest visible cost while ignoring the higher hidden cost of instability.
Common blind spots in cross-border sourcing and distribution
Cross-border sourcing adds complexity that standard supply chain dashboards rarely explain well. A shipment marked “in transit” may still face documentation mismatch, port congestion, packaging nonconformity, or local clearance delay. These issues can add 3–10 days in routine cases and significantly more during peak periods. For channel partners, the operational consequence is not just delay but weakened customer service planning.
Another blind spot is false substitution confidence. Buyers sometimes assume that if two automotive parts or industrial components look similar, they are easy to replace. In reality, substitute risk depends on tolerances, mounting compatibility, regulatory fit, test record continuity, and after-sales expectations. A low-cost substitute may create a high downstream support burden if fitment or performance consistency is poor.
Documentation is also underestimated. In many sourcing programs, the first red flag is not a missed shipment but fragmented paperwork: inconsistent packing lists, delayed specification sheets, or unclear origin data. When teams work across 2–3 regions and multiple distribution channels, document discipline becomes a risk control tool, not an administrative detail.
These blind spots are especially relevant for distributors and agents managing broad SKU portfolios. A visible stock position may look healthy, while actual sell-through risk is rising because fitment records, batch traceability, or customer complaint trends are not being integrated into supply chain review.
What procurement teams should check every month or quarter
- Monthly: lead-time drift, urgent order acceptance rate, and response speed for technical questions.
- Quarterly: MOQ changes, packaging complaints, customs-related delays, and document revision accuracy.
- Every major sourcing cycle: alternate source readiness, tooling dependency, and region-specific compliance fit.
FAQ for buyers, researchers, and distributors
How can I tell if a supplier is stable when the dashboard still looks normal?
Look for pattern changes rather than isolated events. If response time stretches from same-day to 48–72 hours, if drawings need repeated clarification, or if quoted lead times become less precise over 1–2 months, risk may be rising even when shipments are still arriving. Stability is usually visible in consistency, not in a single KPI.
What matters more for industrial parts procurement: unit price or lead-time resilience?
It depends on the part’s substitution difficulty and the cost of delay. For common items, price may dominate. For custom components, EV battery-related parts, or precision automotive parts with longer validation cycles, lead-time resilience often has greater business value. A cheaper part can become expensive if it forces buffer stock, overtime, delayed launch, or customer penalties.
Are standard certifications enough to reduce supply chain risk?
Certifications help, but they do not replace active supplier assessment. Buyers should also verify document control, traceability practice, packaging compliance, and communication reliability. In many real sourcing situations, execution discipline matters as much as certificate presence.
How many suppliers should I compare before locking a sourcing decision?
For standard industrial or aftermarket parts, comparing 2–3 viable sources is usually practical. For custom or technically sensitive components, a wider scan may be needed even if only 2 candidates reach the final stage. The goal is not volume of options, but clear visibility on trade-offs in cost, risk, and delivery capability.
Why industrial intelligence matters more than isolated dashboard data
A modern supply chain is not only a movement of goods. It is a network of technical specifications, regional regulations, sub-supplier dependencies, logistics capacity, and changing market demand. Standard dashboards usually capture only one layer. Industrial intelligence connects the layers. That is why procurement decisions improve when companies combine operational data with trade insight, market interpretation, and sector expertise.
GIIH is built for this broader decision environment. Its strength lies in turning fragmented industrial information into structured decision support across logistics, trade, precision automotive parts, smart systems, and other strategic sectors. For buyers and analysts, that means faster identification of hidden supply chain risk, clearer sourcing comparisons, and more useful signals for planning under uncertainty.
This is particularly valuable when your team must decide across multiple variables at once: whether a supplier can support a 4–12 week launch window, whether a distributor network can absorb regional demand fluctuation, whether documentation is sufficient for customs and channel compliance, or whether a lower unit price creates higher operational exposure over the next quarter.
If your current dashboard shows activity but not enough explanation, the next step is not simply more data. It is better interpretation. That is the difference between seeing shipments and understanding supply chain risk.
Why choose us
GIIH helps information researchers, procurement teams, business evaluators, distributors, and agents move from scattered market signals to actionable industrial decisions. Our cross-sector intelligence model combines logistics insight, trade analysis, manufacturing understanding, and technical interpretation, which is especially useful for automotive components, industrial parts, EV-related sourcing, and custom supply programs.
You can contact us for practical support on supplier screening, sourcing comparison, delivery cycle assessment, documentation review, market entry questions, channel suitability, and risk mapping for industrial procurement. If you need help confirming technical parameters, evaluating product selection, comparing lead times, checking compliance expectations, discussing sample support, or organizing quotation communication, GIIH can help structure the decision process.
For teams facing unclear supplier options, tight project timing, or rising uncertainty in global supply chains, a more informed decision framework can protect both margin and continuity. GIIH provides the intelligence bridge between market complexity and practical action.
- health
- industrial intelligence
- technical specifications
- global supply chain
- precision automotive
- industrial decision
- cross-border trade
- supply chain
- logistics management
- inventory control
- procurement
- auto parts
- automotive components
- EV battery
- EV motor
- precision parts
- custom components
- high-quality parts
- precision engineering
- industrial parts
- aftermarket
Recommended News
 Sep 24, 2026When does supply chain management software pay for itself?Supply chain management software pays for itself by reducing avoidable inventory, freight, stockout, and planning costs. Learn how to build a credible ROI case.
 Sep 20, 2026How supplier compliance monitoring reduces disruption riskSupplier compliance monitoring helps teams spot risks early, prevent costly disruptions, strengthen supplier resilience, and protect operational continuity.
 Sep 16, 2026What makes a procurement research platform reliable for supplier sourcing?A procurement research platform for sourcing helps teams identify credible suppliers, assess risk, verify evidence, and build defensible shortlists for smarter decisions.
 Sep 07, 2026How to compare cross border logistics services for reliable deliveryCompare cross border logistics services with confidence. Learn how to assess customs, tracking, costs, final-mile coverage, and exception handling for reliable delivery.
 Sep 05, 2026How to Compare an Order Fulfillment Pricing Model by Total CostOrder fulfillment pricing model guide: compare total costs across storage, shipping, returns, fees, and service levels to select the right fulfillment partner.
 Sep 07, 2026Sourcing Semi-Trailer Spare Parts Without Compromising Brake Drum QualitySemi trailer spare parts sourcing guide: choose reliable brake drums with verified fitment, traceability, and quality control to protect safety, uptime, and costs.
 Aug 28, 2026France Lowers Foreign Investment Review Threshold to 10% for Non-EU BuyersFrance lowers its foreign investment review threshold to 10% for non-EU buyers, reshaping strategic deals, compliance planning, and cross-border investment.
 Aug 25, 2026Vietnam Cuts Anti-Dumping Duty on Chinese H-Beam Steel to 6.78%Vietnam cuts anti-dumping duty on Chinese H-beam steel to 6.78%, reshaping import costs and sourcing decisions in Southeast Asia. See what buyers and traders should do next.
 Aug 21, 2026France Lowers Foreign Investment Review Threshold to 10% for Non-EU BuyersFrance lowers its foreign investment review threshold to 10% for non-EU buyers, reshaping deals in strategic sectors. See what this means for investors, timelines, and cross-border transaction risk.
 Aug 20, 2026BRICS Reaches Consensus on Green Minerals Supply Chains and Wider Local-Currency TradeBRICS green minerals supply chains and wider local-currency trade could reshape industrial exports, settlement, and compliance. See what Chinese exporters should watch next.
 Aug 19, 2026RCEP Steel Conference in Nanning Highlights Green Low-Carbon Technology CooperationRCEP Steel Conference in Nanning highlights green low-carbon technology cooperation, tariff rules, and compliance trends shaping steel exports, supply chains, and new regional business opportunities.
 Aug 18, 2026Second Strait of Hormuz Closure Raises Supply Chain Risks as Oil and Freight Costs ClimbSecond Strait of Hormuz closure raises supply chain risks as oil and freight costs climb. Explore impacts on shipping, pricing, and key export sectors now.
 Aug 16, 2026EU Battery Passport Becomes Mandatory for Exported Storage Products on August 18EU Battery Passport becomes mandatory on August 18, 2026 for exported storage products above 2kWh. Learn what Chinese exporters, integrators, and OEMs must do to stay compliant.
 Aug 15, 2026China Widens Cross-Border Cash Pool Access for Multinationals on Sept. 14China widens cross-border cash pooling for multinationals on Sept. 14, boosting treasury efficiency, liquidity, and payment coordination for China-linked businesses.
 Aug 13, 2026EU Ends Low-Value Parcel Duty ExemptionEU ends the low-value parcel duty exemption, reshaping China-to-EU e-commerce costs, customs compliance, and delivery models for exporters and logistics teams.
 Aug 12, 2026Jiangsu Tightens Overseas Patent Rules for ExportersJiangsu Tightens Overseas Patent Rules for Exporters: learn how new patent search, design-around, and local filing demands may reshape market access in the US, Europe, and Southeast Asia.
 Aug 11, 2026EU CBAM Expansion Adds Hydrogen Products, Pre-Filing Starts Oct 2026EU CBAM expansion adds hydrogen products and starts pre-filing in Oct 2026. Learn how Chinese exporters can prepare carbon data, electricity records, and compliance workflows now.
 Jul 15, 2026Global Shipping Logistics Customs Clearance: Common Delays and How to Prevent ThemGlobal shipping logistics customs clearance made simple: learn the most common delay triggers, reduce document and HS code errors, and keep cross-border shipments moving faster.
 Jul 13, 2026Cloud Project Specification Planning: How to Prevent Scope Gaps Before Procurement StartsCloud project specification planning helps teams define scope, compliance, integrations, and cost drivers before procurement begins—reducing risk, avoiding change requests, and improving vendor fit.
 Jul 12, 2026Logistics Management Analytics: Which KPIs Improve Delivery and Inventory Control?Logistics management analytics helps identify the KPIs that truly improve delivery speed, inventory accuracy, and service reliability across complex supply chains.
 Jul 11, 2026Ecommerce Logistics Sourcing Guide: How to Compare Lead Time, MOQ, and Shipping CostsEcommerce logistics sourcing guide for buyers comparing lead time, MOQ, and shipping costs. Learn how to reduce landed cost risk, improve supplier selection, and make smarter sourcing decisions.
 Jul 10, 2026Supply Chain Bottleneck Analysis for Exporters: Where Delays Happen and How to RespondSupply chain bottleneck analysis for exporters reveals where delays start—from suppliers and documentation to ports and delivery—and shows practical ways to respond faster, cut risk, and protect margins.
 Jul 09, 2026Supply Chain Intelligence Europe: Which Data Signals Matter for Sourcing Decisions?Supply chain intelligence Europe: discover the key data signals shaping smarter sourcing decisions, from supplier risk and lead times to compliance, costs, and logistics performance.
![]() Jul 07, 2026Supply Chain Intelligence and ISO Standards: How to Align Data, Traceability, and ComplianceSupply chain intelligence ISO standards explained: learn how to align data, traceability, and compliance to reduce risk, speed audits, and build resilient operations.
Jul 07, 2026Supply Chain Intelligence and ISO Standards: How to Align Data, Traceability, and ComplianceSupply chain intelligence ISO standards explained: learn how to align data, traceability, and compliance to reduce risk, speed audits, and build resilient operations.