


Search News
Global Industrial Intelligence Hub (GIIH)Industry Portal
Global Industrial Intelligence Hub (GIIH)Status
Standard Access
Upgrade to PremiumNewsWhy logistics management tools still miss real bottlenecks
Time
Click Count
Despite heavy investment in logistics management tools, many supply chain teams still struggle to identify the real bottlenecks behind delays, rising costs, and weak inventory control. For procurement leaders, distributors, and market researchers dealing with aftermarket auto parts, industrial parts, precision engineering, EV components, and car spare parts, the gap often lies not in data volume but in how operational signals are interpreted across sourcing, warehousing, and fulfillment.
That gap matters because logistics performance is no longer judged only by whether a shipment arrives. In cross-border trade, buyers now measure fill rate, exception handling speed, stock accuracy, inbound lead time, and the ability to respond to demand spikes within 24–72 hours. A dashboard may show on-time delivery at 92%, yet still conceal slow supplier confirmation, carton-level picking errors, or customs document rework that repeatedly erodes margin.
For B2B teams working across industrial distribution and automotive parts channels, the real challenge is operational visibility with context. A transport management module may flag route delays, but it often misses why the warehouse released orders 8 hours late, why replenishment logic ignored low-turn SKUs with high service importance, or why a procurement handoff added 2 extra approval cycles. These are the bottlenecks that software alone does not surface.
This article examines why logistics management tools still miss real bottlenecks, where blind spots usually occur, and how decision-makers can build a more reliable diagnosis model. It is especially relevant for sourcing teams, commercial evaluators, and channel partners who need logistics intelligence that supports purchasing decisions, market expansion, and supply chain risk control.
Why visibility tools often stop at symptoms, not root causes
Most logistics platforms are strong at reporting events but weaker at interpreting operational dependencies. They record milestones such as goods received, order packed, shipment dispatched, or delivery signed. What they often do not explain is whether a delay started 3 days earlier in supplier allocation, in BOM-related component substitution, or in a warehouse slotting rule that increased travel time per pick from 45 seconds to 90 seconds.
In sectors like aftermarket auto parts and EV components, bottlenecks are rarely isolated. One late inbound container can trigger a cascade across quality inspection, repacking, documentation, and distributor replenishment. If a tool only shows the final delay node, managers may overreact to the carrier while ignoring the actual issue: for example, an inbound quality hold rate above 5%, incomplete ASN data, or part-number mismatch between supplier labels and internal SKU logic.
Another reason tools miss the real constraint is that they are configured around standard workflows, while industrial trade often runs on exceptions. Mixed pallets, urgent service parts, low-volume SKUs, and region-specific compliance documents create edge cases that represent only 10%–15% of total transactions but consume 40% or more of problem-solving time. If those exceptions are not mapped, the dashboard looks stable while operational teams remain overloaded.
Three common diagnosis gaps
- Event-only tracking: The system logs what happened, but not the decision rule behind it.
- Department silos: Procurement, warehouse, and transport KPIs are measured separately, so no one sees the full 5-step chain.
- Static thresholds: Alerts are triggered at fixed limits, such as 48-hour delay, even when product criticality or customer SLA requires a 12-hour response.
For information researchers and commercial assessment teams, this means logistics data should be read as a chain of causality, not a collection of timestamps. A late shipment may be a planning issue, a master data issue, or a supplier collaboration issue. Without that distinction, software investments create visibility but not control.
Operational signal vs. real bottleneck
The table below shows how an apparent logistics symptom can point to a different operational source. This distinction is critical when evaluating vendors, warehouses, or regional distribution models.
The key takeaway is that visible logistics friction often starts outside the transport screen. Root-cause analysis must connect supplier behavior, data quality, warehouse execution, and order prioritization in one view. That is where many tools remain incomplete.
Where hidden bottlenecks appear across sourcing, warehousing, and fulfillment
Real bottlenecks usually emerge at handoff points rather than within a single function. In industrial distribution, there are at least 4 high-risk transitions: supplier to inbound booking, inbound to quality release, warehouse to order allocation, and allocation to carrier dispatch. Even a 2-hour delay at each handoff can create a full 1-day slip by the time the shipment leaves the facility.
Sourcing teams often underestimate the logistics effect of supplier variability. If purchase order confirmation arrives 24–48 hours late, planners cannot secure slots, reserve labor, or align consolidation plans. For precision parts and car spare parts, where packaging, serial control, and part traceability matter, incomplete packing lists can add another 1–2 days to receiving accuracy checks.
Warehousing introduces a second layer of blind spots. A warehouse management system may show acceptable throughput at the site level while still hiding SKU-specific congestion. For example, bulky EV components may require special handling equipment, lower stack height, or separate battery-related safety procedures. If these operational rules are not reflected in planning logic, the same zone can repeatedly become the constraint every week.
Fulfillment adds a third challenge: priority distortion. Not all orders carry the same business weight. A low-volume service part for a repair network may be more urgent than a bulk replenishment order. Yet many systems prioritize by order creation time or carton count, not by downstream revenue risk, contractual service requirement, or customer criticality.
High-risk handoff points to audit
- Supplier booking compliance: Are ASN, packing data, and pallet labels submitted at least 12–24 hours before arrival?
- Inbound inspection cycle: Does quality release stay within 6–12 hours for standard SKUs and 24 hours for controlled items?
- Wave planning logic: Are urgent service parts separated from bulk replenishment waves?
- Dispatch readiness: Is the carrier waiting for freight, or is freight waiting for documentation and release?
For procurement and business evaluation teams, these handoff checks are more useful than broad claims about “smart logistics.” They reveal whether an operation can support channel reliability, not just whether software has modern features.
Typical bottlenecks by process stage
A stage-by-stage map helps identify where intervention will generate the fastest operational return. The following comparison can support warehouse audits, supplier reviews, and regional logistics planning.
When these metrics are reviewed together, patterns become clearer. A company may think it has a transport problem, but the data may show 70% of delays begin before loading. That insight changes both procurement strategy and technology investment priorities.
What procurement and commercial teams should evaluate beyond software features
When selecting logistics management tools or logistics partners, buyers often focus on dashboards, API readiness, or automated alerts. These matter, but they are not enough. The more practical question is whether the tool can expose operational friction at the SKU, supplier, lane, and order-priority levels. If it cannot, decision-makers may buy visibility without gaining a stronger service outcome.
For distributors and agents, logistics quality directly affects channel confidence. If emergency parts repeatedly miss the promised 24-hour or 48-hour target, dealers adjust ordering behavior, hold extra safety stock, or reduce dependence on the supplier. That can lock working capital and weaken market responsiveness even if the software vendor reports good system uptime.
Commercial evaluators should also ask whether the solution supports multi-node logic. A single-country warehouse model has very different decision needs from a network with bonded storage, overseas warehouses, regional replenishment hubs, and local courier handoff. Systems that aggregate data too early can blur meaningful differences between lanes, customers, and product families.
Four evaluation lenses that matter in B2B trade
- Diagnostic depth: Can the platform trace exceptions back 2–3 process steps instead of only reporting the final delay?
- Decision usability: Are alerts tied to actions such as expedite, re-slot, split shipment, or supplier escalation?
- Product sensitivity: Can the logic distinguish fast-moving kits, low-volume service parts, hazardous items, and oversized components?
- Commercial relevance: Does reporting align with fill rate, landed cost, service-level agreements, and customer class?
A useful procurement review should combine system capability with process maturity. A warehouse may have advanced scanning and strong visualization, but if item master data has 3%–5% labeling inconsistency, root-cause analysis will remain weak. Likewise, a control tower may issue alerts every hour, but if no escalation owner is assigned, the business still absorbs delay costs.
Practical buyer checklist
The checklist below can help sourcing teams compare solutions and service models in a more operationally grounded way.
This kind of review shifts the conversation from feature comparison to business fit. For industrial buyers, that is usually where hidden risk either becomes visible or remains expensive.
How to build a more accurate bottleneck diagnosis model
A better diagnosis model starts by treating logistics as a linked operating system rather than a sequence of isolated transactions. The goal is not more alerts. It is a cleaner connection between signal, cause, action, and commercial consequence. For many organizations, this requires a 3-layer framework: process mapping, exception segmentation, and decision governance.
First, map the end-to-end flow in enough detail to reveal where time is really consumed. In practice, this means splitting cycle time into at least 6 segments: supplier confirmation, booking, inbound receiving, quality release, picking and packing, and carrier dispatch. Once measured separately, teams often discover that transport accounts for less than half of total delay minutes.
Second, segment exceptions by business impact. A 1-day delay on a low-value replenishment order is not equal to a 6-hour delay on a high-priority service component. Companies that classify exceptions into 3 levels—critical, important, routine—usually respond faster because action paths are predefined instead of improvised.
Third, assign ownership across functions. Root-cause diagnosis fails when issues are visible but no one is accountable. Procurement should own supplier confirmation variance. Warehouse operations should own dock-to-stock and release-to-dispatch time. Commercial teams should define service priorities based on customer and market impact.
A 5-step implementation sequence
- Identify the top 20 delay scenarios by frequency and cost over the last 8–12 weeks.
- Break each scenario into process timestamps and validate data quality at source.
- Define threshold ranges, such as dock-to-stock under 8 hours for standard SKUs.
- Create escalation actions by severity, owner, and response time.
- Review weekly, then redesign rules monthly as demand and product mix change.
Metrics that reveal root causes faster
The following metrics are more useful than broad on-time delivery alone because they expose where operating friction starts and how quickly teams can correct it.
When these metrics are tied to ownership and exception type, logistics management tools become far more useful. They stop being passive reporting layers and start supporting decisions that reduce delay repetition.
FAQ for researchers, buyers, and distributors
How can a company tell whether the bottleneck is in transport or upstream operations?
Track at least 3 timestamp pairs: promised ready date vs. actual warehouse release, warehouse release vs. carrier pickup, and pickup vs. delivery. If the first gap is consistently larger than the second, the issue is likely upstream. In many industrial operations, 50% or more of delay originates before the truck departs.
Useful verification method
Review 20–30 delayed orders over a 4-week period and group them by first point of variance. This small sample often reveals whether the main problem is supplier readiness, warehouse execution, documentation, or carrier reliability.
Which companies are most likely to outgrow basic logistics dashboards?
Businesses with more than 2 warehouse nodes, mixed order profiles, or more than 1,000 active SKUs usually need deeper diagnosis logic. The same applies to organizations handling service parts, EV components, or cross-border shipments with multiple compliance checkpoints. Complexity rises sharply once manual exception handling becomes a daily activity.
What are the most common mistakes during tool selection?
Three mistakes appear often: buying for visualization instead of actionability, measuring generic OTD without SKU or customer segmentation, and assuming data integration alone will solve process ambiguity. If alert logic is weak, better data simply makes confusion more visible.
How long does it usually take to improve bottleneck diagnosis?
A practical first phase can be completed in 4–8 weeks if data access is available and process owners cooperate. That phase should identify top delay categories, baseline 6–10 operational metrics, and establish response rules. Larger network redesign or warehouse re-slotting may take 8–16 additional weeks depending on site count and SKU complexity.
For organizations seeking more reliable supply chain insight, the main lesson is clear: logistics management tools do not fail because they lack data, but because they often lack operational context. Real bottlenecks sit between functions, inside exceptions, and beneath broad performance averages. That is why sourcing, warehousing, and fulfillment must be analyzed as one connected system rather than separate reporting layers.
At GIIH, industrial intelligence is built around exactly this kind of cross-functional visibility. By combining market insight, supply chain observation, and industry-specific analysis across logistics, automotive parts, and global trade, GIIH helps decision-makers move from fragmented signals to actionable judgment. Whether you are evaluating suppliers, reviewing warehouse models, or planning channel expansion, better bottleneck diagnosis leads to stronger service resilience and more confident commercial decisions.
If you need deeper guidance on logistics risk assessment, supplier coordination, or distribution network intelligence, contact GIIH to explore tailored research support, procurement-focused analysis, and practical solutions for complex industrial supply chains.
Recommended News
 Sep 24, 2026When does supply chain management software pay for itself?Supply chain management software pays for itself by reducing avoidable inventory, freight, stockout, and planning costs. Learn how to build a credible ROI case.
 Sep 20, 2026How supplier compliance monitoring reduces disruption riskSupplier compliance monitoring helps teams spot risks early, prevent costly disruptions, strengthen supplier resilience, and protect operational continuity.
 Sep 16, 2026What makes a procurement research platform reliable for supplier sourcing?A procurement research platform for sourcing helps teams identify credible suppliers, assess risk, verify evidence, and build defensible shortlists for smarter decisions.
 Sep 07, 2026How to compare cross border logistics services for reliable deliveryCompare cross border logistics services with confidence. Learn how to assess customs, tracking, costs, final-mile coverage, and exception handling for reliable delivery.
 Sep 05, 2026How to Compare an Order Fulfillment Pricing Model by Total CostOrder fulfillment pricing model guide: compare total costs across storage, shipping, returns, fees, and service levels to select the right fulfillment partner.
 Sep 07, 2026Sourcing Semi-Trailer Spare Parts Without Compromising Brake Drum QualitySemi trailer spare parts sourcing guide: choose reliable brake drums with verified fitment, traceability, and quality control to protect safety, uptime, and costs.
 Aug 28, 2026France Lowers Foreign Investment Review Threshold to 10% for Non-EU BuyersFrance lowers its foreign investment review threshold to 10% for non-EU buyers, reshaping strategic deals, compliance planning, and cross-border investment.
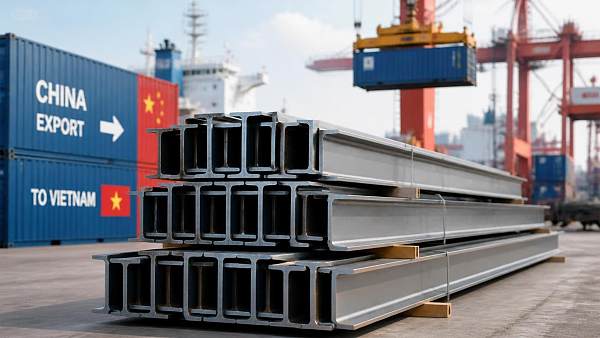
 Aug 25, 2026Vietnam Cuts Anti-Dumping Duty on Chinese H-Beam Steel to 6.78%Vietnam cuts anti-dumping duty on Chinese H-beam steel to 6.78%, reshaping import costs and sourcing decisions in Southeast Asia. See what buyers and traders should do next.
 Aug 21, 2026France Lowers Foreign Investment Review Threshold to 10% for Non-EU BuyersFrance lowers its foreign investment review threshold to 10% for non-EU buyers, reshaping deals in strategic sectors. See what this means for investors, timelines, and cross-border transaction risk.
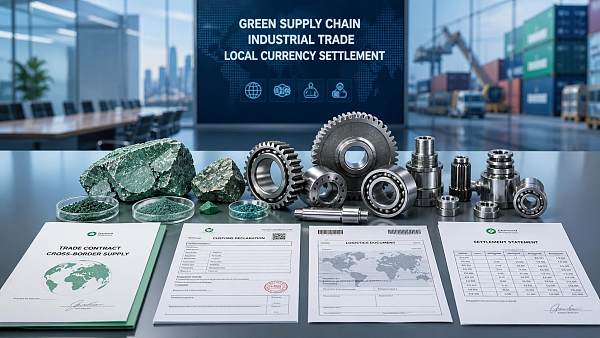
 Aug 20, 2026BRICS Reaches Consensus on Green Minerals Supply Chains and Wider Local-Currency TradeBRICS green minerals supply chains and wider local-currency trade could reshape industrial exports, settlement, and compliance. See what Chinese exporters should watch next.
 Aug 19, 2026RCEP Steel Conference in Nanning Highlights Green Low-Carbon Technology CooperationRCEP Steel Conference in Nanning highlights green low-carbon technology cooperation, tariff rules, and compliance trends shaping steel exports, supply chains, and new regional business opportunities.
 Aug 18, 2026Second Strait of Hormuz Closure Raises Supply Chain Risks as Oil and Freight Costs ClimbSecond Strait of Hormuz closure raises supply chain risks as oil and freight costs climb. Explore impacts on shipping, pricing, and key export sectors now.
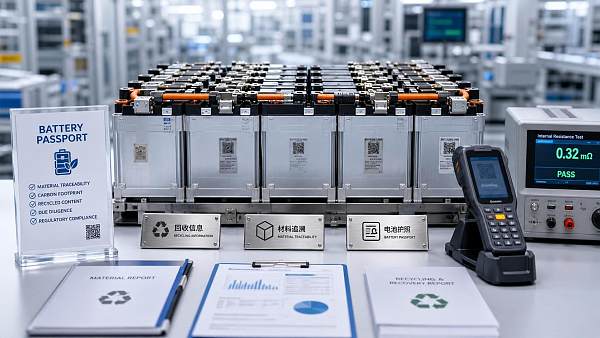
 Aug 16, 2026EU Battery Passport Becomes Mandatory for Exported Storage Products on August 18EU Battery Passport becomes mandatory on August 18, 2026 for exported storage products above 2kWh. Learn what Chinese exporters, integrators, and OEMs must do to stay compliant.
 Aug 15, 2026China Widens Cross-Border Cash Pool Access for Multinationals on Sept. 14China widens cross-border cash pooling for multinationals on Sept. 14, boosting treasury efficiency, liquidity, and payment coordination for China-linked businesses.
 Aug 13, 2026EU Ends Low-Value Parcel Duty ExemptionEU ends the low-value parcel duty exemption, reshaping China-to-EU e-commerce costs, customs compliance, and delivery models for exporters and logistics teams.
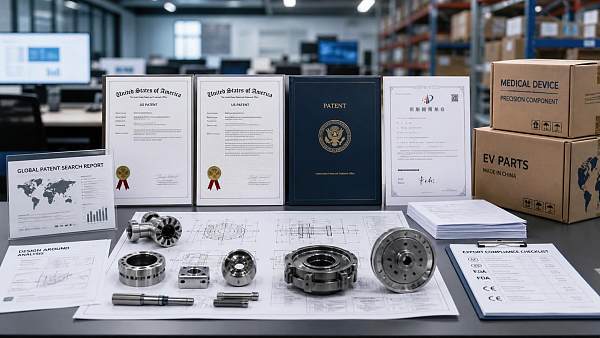
 Aug 12, 2026Jiangsu Tightens Overseas Patent Rules for ExportersJiangsu Tightens Overseas Patent Rules for Exporters: learn how new patent search, design-around, and local filing demands may reshape market access in the US, Europe, and Southeast Asia.
 Aug 11, 2026EU CBAM Expansion Adds Hydrogen Products, Pre-Filing Starts Oct 2026EU CBAM expansion adds hydrogen products and starts pre-filing in Oct 2026. Learn how Chinese exporters can prepare carbon data, electricity records, and compliance workflows now.
 Jul 15, 2026Global Shipping Logistics Customs Clearance: Common Delays and How to Prevent ThemGlobal shipping logistics customs clearance made simple: learn the most common delay triggers, reduce document and HS code errors, and keep cross-border shipments moving faster.
 Jul 13, 2026Cloud Project Specification Planning: How to Prevent Scope Gaps Before Procurement StartsCloud project specification planning helps teams define scope, compliance, integrations, and cost drivers before procurement begins—reducing risk, avoiding change requests, and improving vendor fit.
 Jul 12, 2026Logistics Management Analytics: Which KPIs Improve Delivery and Inventory Control?Logistics management analytics helps identify the KPIs that truly improve delivery speed, inventory accuracy, and service reliability across complex supply chains.
 Jul 11, 2026Ecommerce Logistics Sourcing Guide: How to Compare Lead Time, MOQ, and Shipping CostsEcommerce logistics sourcing guide for buyers comparing lead time, MOQ, and shipping costs. Learn how to reduce landed cost risk, improve supplier selection, and make smarter sourcing decisions.
 Jul 10, 2026Supply Chain Bottleneck Analysis for Exporters: Where Delays Happen and How to RespondSupply chain bottleneck analysis for exporters reveals where delays start—from suppliers and documentation to ports and delivery—and shows practical ways to respond faster, cut risk, and protect margins.
 Jul 09, 2026Supply Chain Intelligence Europe: Which Data Signals Matter for Sourcing Decisions?Supply chain intelligence Europe: discover the key data signals shaping smarter sourcing decisions, from supplier risk and lead times to compliance, costs, and logistics performance.
![]() Jul 07, 2026Supply Chain Intelligence and ISO Standards: How to Align Data, Traceability, and ComplianceSupply chain intelligence ISO standards explained: learn how to align data, traceability, and compliance to reduce risk, speed audits, and build resilient operations.
Jul 07, 2026Supply Chain Intelligence and ISO Standards: How to Align Data, Traceability, and ComplianceSupply chain intelligence ISO standards explained: learn how to align data, traceability, and compliance to reduce risk, speed audits, and build resilient operations.